Nothing makes a body feel as protected from the elements as a solid set of four walls and an up-to-code reinforced roof, but these protective features may not be present when active weather strikes. Many seafarers find themselves subjected to harsh elements, putting them at the mercy of the skies above and the waves alongside their trusted vessels.
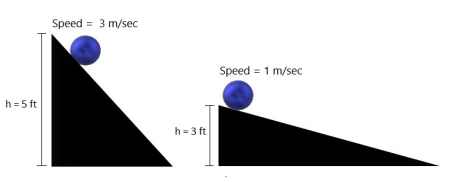
When it comes to the ocean, nothing “stirs the pot” like the wind; and the winds are a response to pressure differences. More specifically, winds move from high to low values of pressure, and the greater the differences between the pressure fields, the faster the wind moves. A good way to visualize this process is to imagine a ball rolling down a hill: the steeper the slope of the hill, the faster the ball will roll. Oh gravity, thou are a heartless force.
The steeper slope will yield a faster speed as a result of gravity.
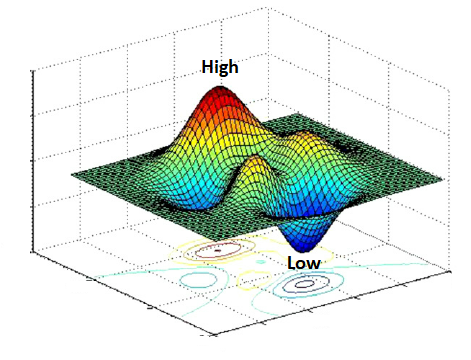
High pressures can ultimately be thought of as “hills”, the low pressures as the “dips”, and the ball is the “wind”. So when analyzing atmospheric pressure patterns, much like a contour elevation map would indicate the steepness or grade to a hiker, tightly spaced pressure contours indicate a steep pressure change pattern, hence higher winds.
Winds will flow from high to low pressures, and the steeper the slope, the faster the winds.Tightened pressure contours between a high and low pressure indicates a steep slope, which yields faster moving winds.
So the wind blows and the waves react as a result. Now depending on the size and location of the pressure patterns, winds and therefore waves of various sizes can be produced and travel away from their origin location. Wind waves are a result of local winds blowing across the surface of the water that eventually break or reach a shoreline.
If no deterrent is present, these waves have the ability to propagate over hundreds of miles as a result of their momentum. This is known as groundswell
Waves can often aid a vessel along its course, acting like a turbocharged engine to work in tandem with the boats own gas/diesel power. However there are the other instances in which the waves become the foe. Increased wave heights, including the elusive rogue waves can roll and/or even break a vessel, overpower engines or snap rudders, leaving a craft at the mercy of the winds.
While most know the tale of the RMS Titanic, other maritime disasters have encountered similar fates as a potential result of winds and their respective waves. A 656 ft German merchant ship, the MSMünchen, departed Bremerhaven, Germany on December 7th, 1978 on a transatlantic voyage towards Savannah, GA. In the early morning hours of December 12, the MS München sent out an S.O.S. signal, with its last reported position. All search efforts were officially called off on December 22, with emergency buoys, life rafts, life vests and belts, and lifeboats retrieved from search operations and random encounters. The MSMünchen was never located, but via investigations done on the salvaged lifeboats, it has been theorized that via severe weather, she likely succumbed to a series of large waves which both broke over the bow and eventually flooded the vessel, causing it to sink.
While it may be easier to associate poor conditions with big patterns, sometimes small scale phenomena can produced localized increases not seen in the big picture. Two examples of this would be squall lines and water spouts.
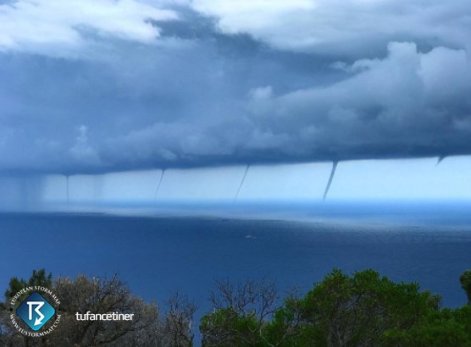
Waterspouts can be sub-categorized into tornadic and non-tornadic, as a result of their formation source. The fair-weather types are most frequent, and are considered non-tornadic in nature, meaning they aren’t associated with a supercell thunderstorm as are the rarer tornadic waterspouts. Typical non-tornadic waterspouts start forming on ocean/lake surface and rise up to meet the base of a parent cloud. They tend to last less than 20 minutes and produce winds less than 70mph, which would classify it as the equivalent of an EF-0 tornado. Tornadic water spouts are a result of a rotating cloud which produces a tornado that then descends and connects to the surface of a body of water. While limited in space and time, either type of waterspouts can locally whip up winds and waters, and boaters are advised to stay clear.
Waterspouts in St. Thomas, US Virgin Islands | Photo by EricksonWaterspouts on the Mediterranean | Photo by Mehmet GökyigitWaterspouts off the coast of Turkey | Photo by Tufancetiner
Tornadic waterspouts can also be associated with squall lines, which is a typically narrow but elongated band of intense thunderstorms. The formation of a squall line in the near or offshore waters is usually ahead with an oncoming cold front associated with a low pressure. While generally measuring about 10-20 miles wide, squall lines can stretch for hundreds of miles, and are capable of producing, tornadoes/waterspouts, damaging winds, and frequent lightning. An incoming frontal boundary from the West or Northwest will alter winds in a location as follows: Initial winds will be from the east/southeast to south, as the winds begin blowing from the local higher pressure towards the incoming lower pressure. As the frontal boundary nears, winds will become south/southwest, finally becoming west/northwest as it departs. When a squall line approaches ahead of the frontal boundary, wind shifts can be sudden and fierce which leaves little time for vessel preparation.
A squall Line as seen on radar, ahead of the main boundary line.
Squall Line as seen from Lauderdale-By-The-Sea | Photo by Weather Forecast Solutions
From the small scale back to the large, no other weather phenomena has the power and expansive reach than that of a tropical cyclone. The amount of energy generated during the evaporation and condensation processes that produce the clouds/rain is almost 200 times the world’s electrical generating abilities, while the amount generated via the wind is roughly half of the world’s electrical generating abilities. The movement across the ocean basins can generate long range swells that can be felt several hundred miles away. Navigating a vessel around the associated increases can be tricky and requires advanced knowledge of environmental factors to determine potential storm trajectories.
Visible satellite, mid-level relative humidity, and steering flow of 2016’s Hurricane Matthew. This image was produced while Matthew was a category 3 system; less than 8 hrs later, Matthew would briefly strengthen into a category 5 system. This system made 4 separate landfalls: Haiti [cat 4], Cuba [cat 4], The Bahamas [cat 3 & 4], and South Carolina [cat 1]
When interaction with a system is imminent, understanding how to circumnavigating via the “Front Right Quadrant” [FRQ] becomes key. If one was to intersect the system with a “+” sign, the FRQ is defined as the front and right side of the system, relative to the storms forward motion. This is where the storm’s winds work in tandem with the directional wind to produce the highest winds of the cyclone. In other words, the side to be avoided if at all possible.
The front right quadrant, relative to the direction of motion, indicates where the strongest winds of a tropical cyclone are located. This is where the systems’ winds work in tandem with the motion.
While there are many hazards out to sea, advanced planning and a working knowledge of the science behind these risks can help minimize disasters out to sea. Knowledge is power and coupled with a bit of luck, here’s hoping for fair winds and following seas.
For all the #boaters in the [aquatic] house, increased conditions in vicinity of [20-25 kts] winds and [4-6 ft] seas behind the frontal boundary [white line] in the NW Gulf of Mexico.
These increases will continue to propagate eastward through the Gulf through early Tuesday, arriving along the East Gulf waters by Monday afternoon. Strong northerly winds will continue to build in behind the boundary, likely remaining in and around [10-15 kts] through early Monday morning.
Elsewhere, southerly flow along the U.S. East coast will continue to increase through midweek, with sea heights additionally increasing beyond [6 ft] as the weak low off the East Coast of #Florida lifts northwards and towards the #MidAtlantic.
NOTE: Img indicates significant wave heights in ft and winds in kts.
The following is an image of visible satellite, radar, surface winds, and the current location of a frontal boundary draped through the eastern half of the U.S.
Same Atlantic flow plus Gulf of Mexico moisture piggybacking on the southeastern and southerly winds into the interior Gulf Coast and Southeast U.S. states, pooling in the vicinity of the slowly northward drifting frontal boundary.
Daytime heating will further induce instability in the region, igniting showers and #thunderstorms today and tonight. Some showers and storms will produce locally heavy rains, with flooding may be a concern in some areas.
Cyclone Cook is currently aiming towards New Zealand, with 30-40 kt winds along the East Coast of the North Island and off the East Coast of the South Island. Winds will become more northerly as the system continues to slide southward through the remainder Friday and into early Saturday [local NZ time]. Winds in excess of 20kts will remain along the North Island through Saturday afternoon [local NZ time], subsiding below 15 kts by Sunday evening/early Monday [local NZ time]
As we approach the 2017 Atlantic Hurricane Season [Jun 01-Nov 30], observing the sea surface temperatures [SST] indicates the “hot spots”, no pun intended, for hurricane development/intensification. By the way, the term “hurricane” is synonymous with cyclone and typhoon, with the only difference being where they are geographically located: Hurricanes refer to tropical cyclones located in the Atlantic and Eastern Pacific Ocean, typhoons are tropical cyclones located in the Central and Western Pacific waters. And the Indian and South Pacific Ocean basins simply refer to them by their general name, cyclones.
While SST values are one of the important determining factors to observe, cyclogenesis [the birth of a cyclone] requires a specific set of conditions to be in place in order for actual development/intensification to occur. Let’s dissect these 6 major ingredients to fully understand the complexity of one of nature’s most powerful systems.
1. Sea surface temperatures [SST]: Minimum SST of 26.5 °C [79.7 °F] is necessary to provide enough heat content to “fuel” the system. This temperature needs to be distributed through at least 50 meters [164 ft] in ocean depth. According to Richard A. Dare and John L. McBride of the Centre for Australian Weather and Climate Research, Bureau of Meteorology in Melbourne, Australia, 98.3% of global cyclone formation occurs when SST values exceeding 25.5°C [77.9 °F]. So while meteorologists may watch thunderstorms pumping off the African Coast in anticipation of cyclone development, until there is sufficient water temperatures to fuel future development, the thunderstorm moves offshore and remains just a thunderstorm out to sea.
Atlantic Ocean basin sea surface temperatures [SST} for March 21, 2017.
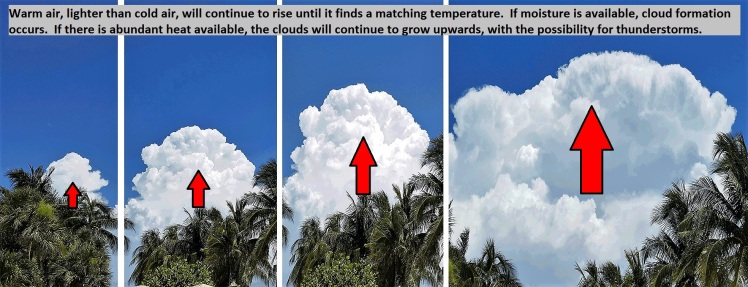
2. Unstable Atmosphere/Vertical Motion: An unstable atmosphere is defined by one in which warm air continues to rise until it finds itself surrounding by air of an identical temperature. Once it finds its “home base”, this is what is known as equilibrium. So what causes this warm air to rise? The answer lies within the density differences between warm and cold air. Say what now? Did things just get all science-y up in here? Well, imagine you were in a 10’ x 10’ room in the middle of a Siberian winter, with no heat; you would want to fill this room with as many people as possible to keep warm, stuffing person after person into the space to capitalize on the generated body heat. Now imagine the same 10’ x 10’ room is located in the middle of hot Texas summer day with no A/C available; you would want to kick many of these people out of this room, ultimately to keep as much distance between yourself and any other heat generating individuals. Now exchange people for molecules, and the idea of air density should be getting clearer; more people (molecules) in the room (air) makes the room weigh more, less people (molecules) in the same room (air) make the room weigh less. Now you may remember that density was the amount of mass per given volume. So, while the volume of the room stays the same, the amount of molecules (people) is what differs. And there you have it, cold air is denser than warm air, therefore explaining why the warm air continues to rise until it achieves equilibrium. Wow, things are getting heavy around here.
Provided there is adequate moisture present in the atmosphere, this rising warm air and moisture combine work in tandem to develop clouds. If the rising motion continues unchecked, this will allow the clouds to continue building vertically, which now has the potential for thunderstorms.
3. Relative Humidity [RH]: Relative humidity is the amount of moisture available in the atmosphere, compared to how much it could fully hold [100% humidity]. High values of RH need to be present from the lower to middle portions of the atmosphere. So how much is enough? Low values of RH cannot support cloud/thunderstorm development, and the 50% threshold of RH is borderline at best, whereas 70% and above is considered prime RH values.
4. Preexisting condition: It may begin as a simple thunderstorm, but some form of a disturbance or an area of lower pressure relative to its surroundings is the bullet to the trigger. If a disturbance has any chance of developing into something more, it must develop or migrate into a region of the above mentioned factors.
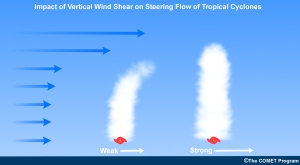
5. Wind Shear: Wind shear is defined as the change in wind speed/direction with height. These changes in wind direction with height must be enough to sustain a counterclockwise flow [low pressure’s spin counterclockwise in the Northern Hemisphere], but not too strong or it may move the heat and moisture away from the center of the system and essentially destroy the vertical integrity of the cloud column.
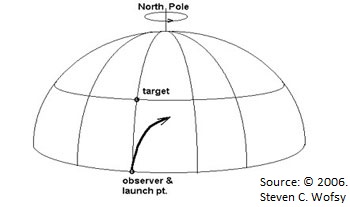
6. Coriolis Force: This is a biggie. This force, as a result of the earth’s rotation, induces motion to the right [Northern Hemisphere] and to the left in the Southern Hemisphere [think of launching missiles. You don’t aim at the target, but slightly off, to compensate for the earth’s rotation.]
In addition, the amount of Coriolis force increases as the distance from the equator increases. The sweet spot for adequate force is about 500 km [310 miles] from the equator, although formation outside of that is entirely possible. It is physically difficult for formation to occur within 5° of the equator, because the amount of Coriolis force is simply too weak. Consequently, once a system rises above 20° latitude, the other above mentioned conditions become harder to maintain/achieve, so the ideal “Goldilocks Zone” for cyclogenesis remains between [5°- 20°].
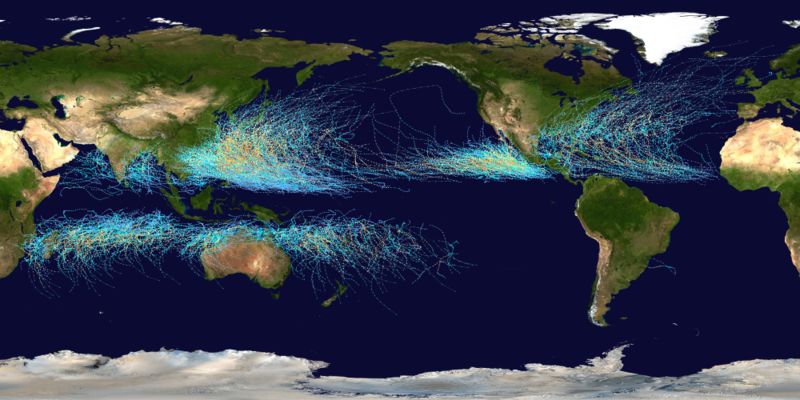
Global tropical cyclone tracks between 1985-2005. Photo courtesy of Nasa.gov
So while the Atlantic Basin hurricane season is generally characterized by the Jun 01 – November 30 time frame, if the above conditions are met outside of that time frame, hurricane formation/intensification is entirely possible. In fact, of all the Atlantic storms on record, 97% have formed within the above mentioned time frame. So what about the other 3%? The earliest known system has been re-analyzed to have occurred in January [1938] and the latest development has occurred in December [1954], towards the end of the month. So while unlikely, it’s both historically and statistically conceivable.
Given the position of the earth and the amount of incoming solar radiation [insolation], ocean basins may indeed reach the required temperatures to support a breeding ground and if all other conditions are met, hurricane-a-typhoon-a-cyclone-a-comin’.
____________
TL;DR
While 97% of storms form within the Jun 01-Nov 30 time frame, 6 major factors are required to produce/sustain cyclone development:
SST’s > 79°F
unstable atmosphere
relative humidity > 60%
existing disturbance
adequate wind shear
enough distance from the equator to experience adequate coriolis force
Stop playin’, read the whole article and learn a lil’ something!
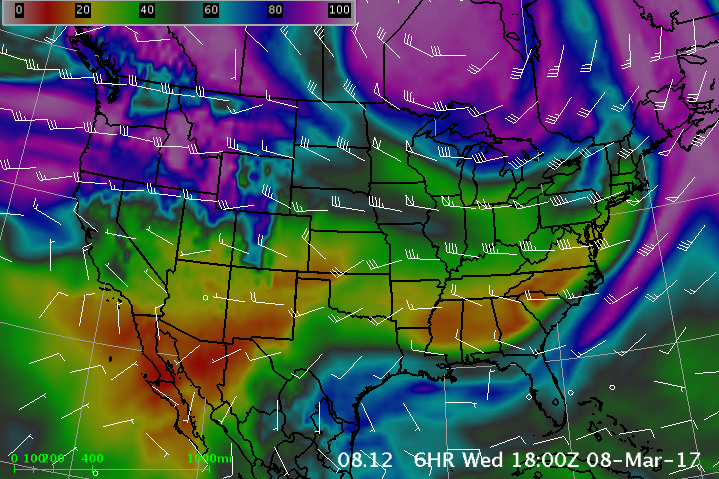
Observe the moisture flow in the 1000-500 mb relative humidity [RH] field.
Cool wraparound feature, as the moisture gets transported on the winds toward the departed NE low on the right hand side of the frame. Also notice the connective feature of the departed low tapping into the moisture pool from the Gulf of Mexico [GOMEX].
West coast also seeing an increase in available atmospheric moisture.
Currently, widespread sea state increases along the U.S. Atlantic Coast, with the highest conditions in vicinity of [10-15 ft]. Offshore conditions even higher, ranging within [15-30 ft]. Conditions to begin reducing from south to north, beginning Wed PM/Thu AM along the SE, Thu PM/early Fri AM along the Mid-Atlantic, and Fri AM/PM in the Northeast.#BoatersBeware
#Blizzard2017 will be one for the record books. This system was a powerful combination of two different atmospheric jets, combining in just the right location, at the right position, to induce a rapidily strenghtening low pressure system just offshore. As the system pulls northward along the coast, its position will enable strong onshore winds bringing larges amounts of moisture.
Find the 3000+ mile frontal boundary via mid level values of RH [relative humidity] and IR [infrared] satellite. Drier air moving into place behind its departure.
Current relative humidity valuesCurrent infrared satellite, radar, and mean sea level pressure.